
Adroit Analytics Drives Environmental Monitoring to the Next Level.
Real-time sensors are now an essential tool for environmental monitoring of all kinds of critical applications. In addition to the benefits of immediate data, dashboards, reporting and the ability to configure alerts for consent breaches, they’re also providing users with powerful insights into the environmental impact of projects.
However, with the rapid uptake of environmental monitoring, especially in construction and worksite management, the translation of data from multiple sensors and locations into effective management information has created the need for data analytics tools to perform this routine task quickly and accurately.
So, with significant numbers of sensors and monitoring solutions now in the field, Adroit is well underway with the development of Adroit Analytics as a valuable addition to the existing Adroit Platform services.
This has involved working with clients across several key industries to understand their individual data reporting needs, and development of automated analytical reporting modules that will enable them to get the best out of the technology they’ve deployed.
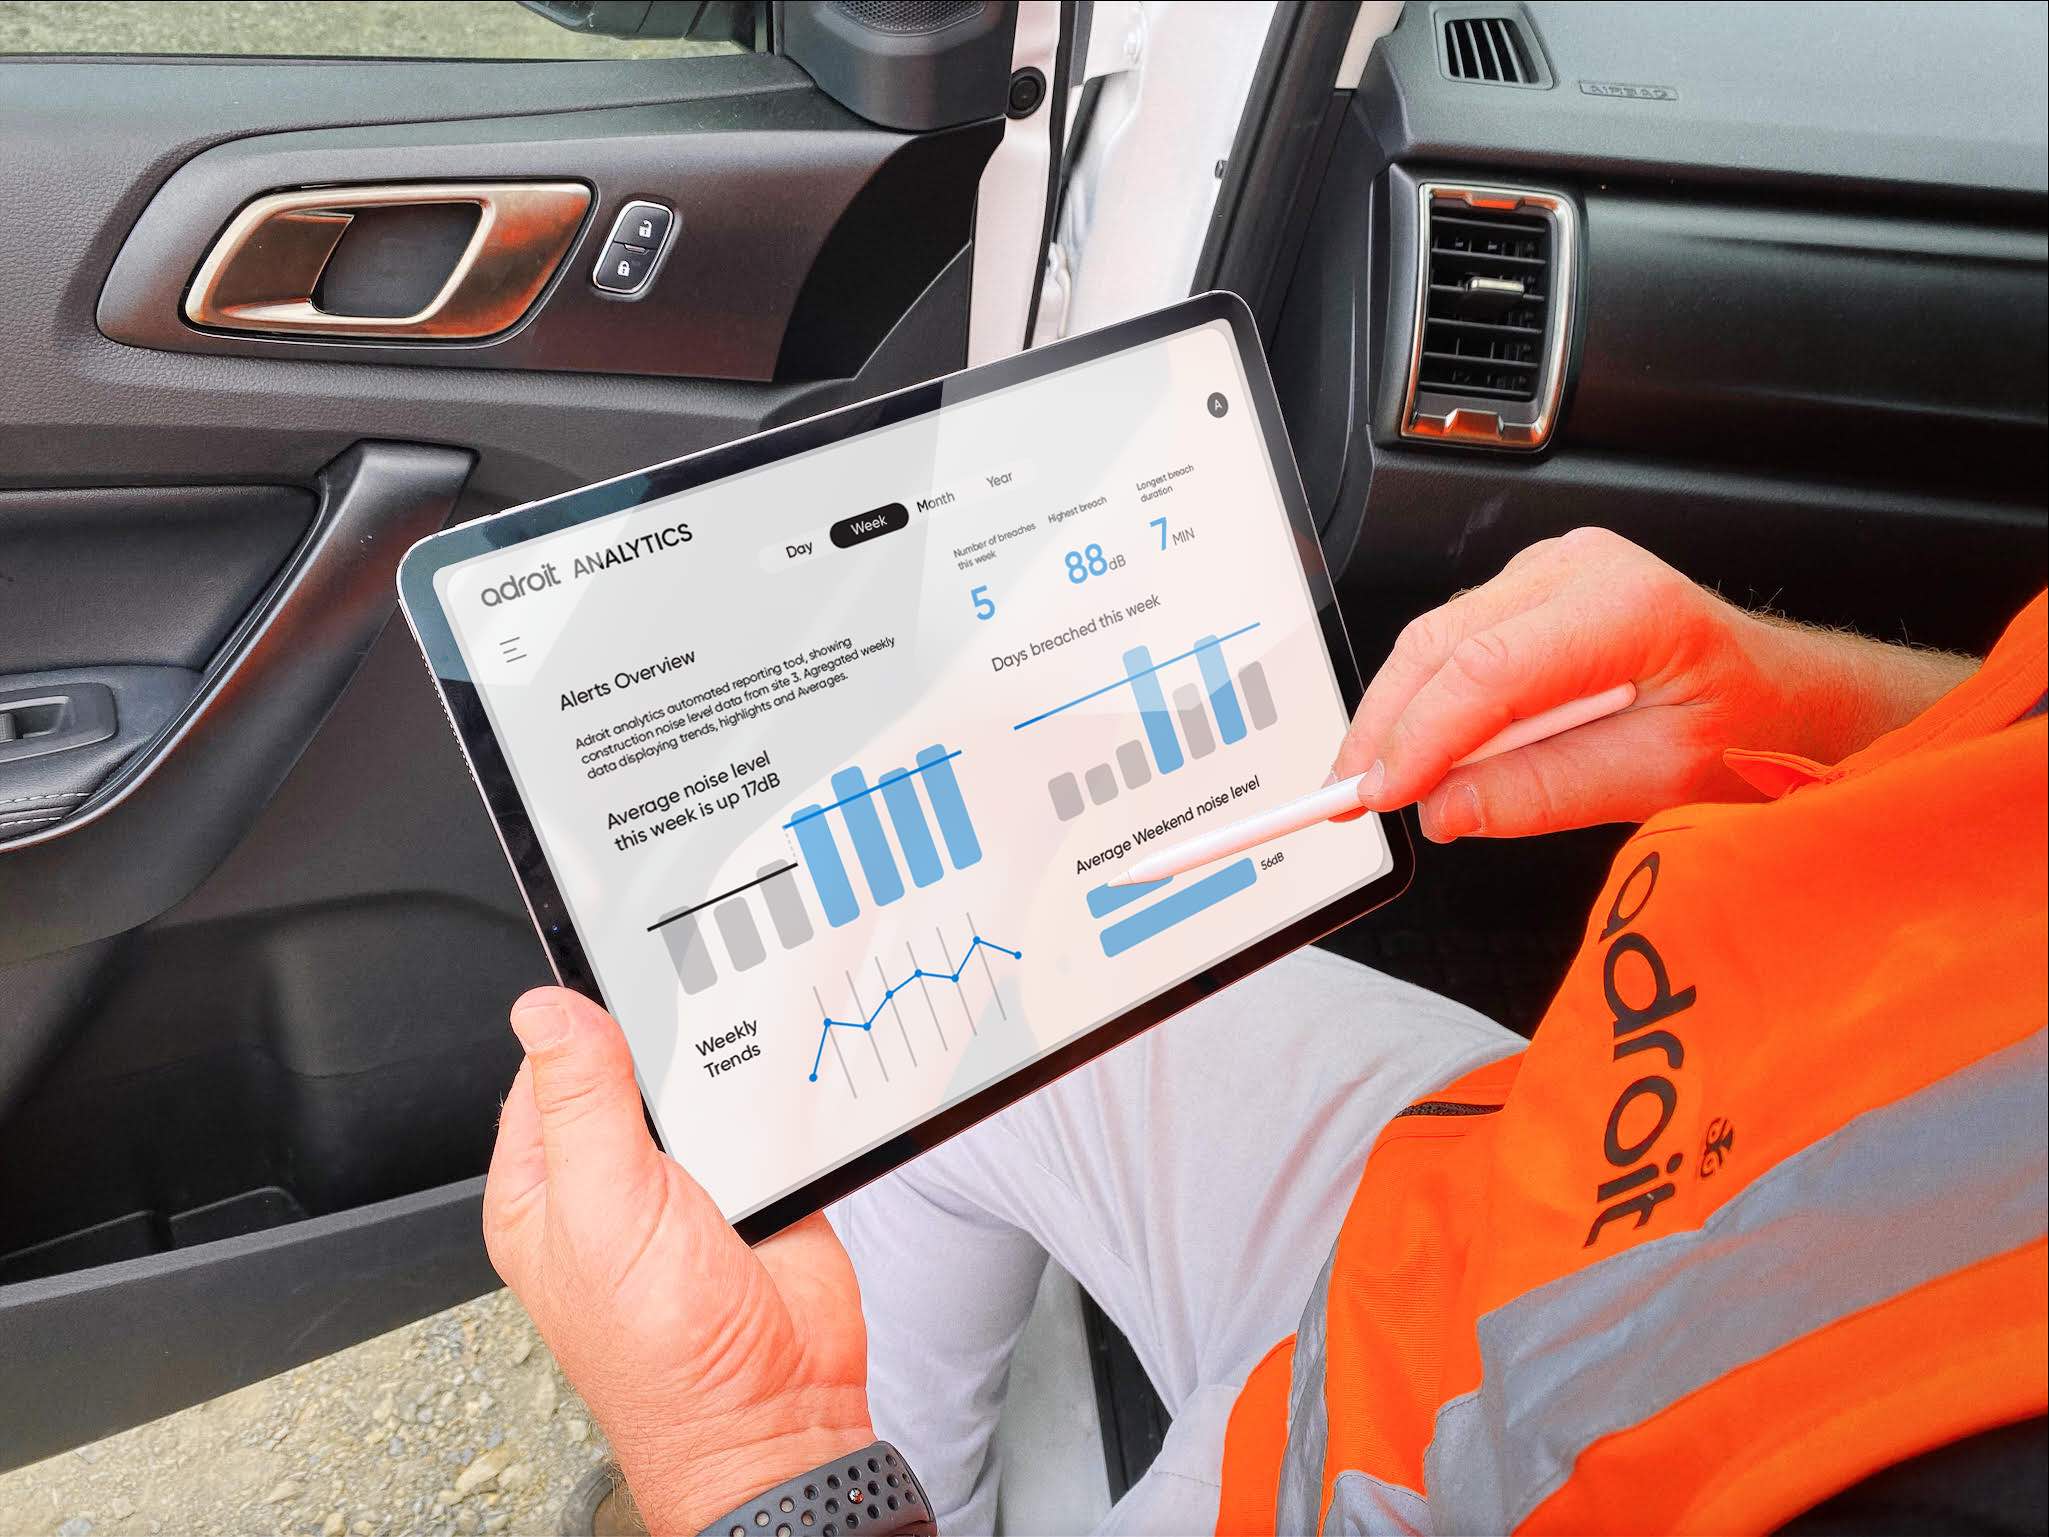
Automated Analytical Reporting
User feedback confirms how important immediate reporting of a spike in noise, dust, vibration, or other environmental factor can be – alerting a manager of a potential breach of consent, workplace incident or environmental hazard.
This data allows managers to immediately respond to what’s happening but also to be aware of issues before a complaint is made.
But when it comes to reporting an issue or series of issues to management, stakeholders or Council, there are a number of other considerations that will make a report more valuable.
- Easy snapshots: Compressing data into simple charts for weekly reporting, with spikes identified for time, place and importance. These can be included in usual workplace reporting, or responses to Council for example.
- Baseline comparison and historical averages: Measuring key factors from the worksite before construction begins so a baseline can be set. Also generating a running average of the worksite by day of the week, or week by week. This provides context and helps identify changes, or breaches of consent conditions more effectively.
- Visualisations: Graphical representations, such as charts and graphs, can make data more understandable. Visualisations can help managers quickly grasp the severity of breaches or underlying trends.
- Error reporting: An unusual spike in data from any individual sensor may not be manmade. So, the ability to overlay data from multiple sensors, or utilising AI or Machine Learning to identify false alerts is a practical option being investigated.
- Predictive Analytics: Armed with baseline and historical data, predictive analytics can be employed to anticipate potential environmental issues. Utilising weather data combined with worksite sensors could predict dust hazard, water table changes, or even flooding for example.
While Adroit installations are already saving time and money for all kinds of businesses, the potential of data use from these sensors is enormous and far-reaching.
Armed with this additional information, users will be better supported in their reporting and better able to limit workplace downtime.
Adroit is working closely with new and existing clients to understand their information requirements and ensure Adroit Analytics meets the needs of each industry. Contact your Adroit or Spark representative to learn more.